____________________________________________________________
Table of Contents
- Details
- Indexes Present
- Dbo.Harvest Primary Key
- All Indexes in DB
- How to Trace It
____________________________________________________________
0__Details
Just Confirming I was in the Right Place,
Was Looking @
- DB
- Dbo.Harvest
- Dbo.Setting
- Dbo.SettingSnapshot
Files: Anything I link or show below can be found here
xx.0 – GMDB Database Locks in Settings Table
____________________________________________________________
1_Indexes Present
- Indexes = Dbo.Harvest
- ‘cnstHarvest’
- This is one due to the Primary Key on the table, and is a non-locking index and *should* not be causing the issue
- Removing this index will remove the ability to ensure the Primary Key is Unique
- Confirmed via a re-creation: Index Creation _ Harvest _ Private Key.sql
- Suggestion: we leave it there, the ‘risk vs reward’ gut check isn’t in our favour.
- ‘cnstHarvest’
- Indexes = Entire Database
- I have extracted all of the potential locking indexes via the below script, results attached:
- Script: Grab All Indexes _ Non Key.sql
- Results: All Indexes in DB_MG.xlsx
- I have extracted all of the potential locking indexes via the below script, results attached:
- Did a second pass, to ensure there wasn’t anything hiding:
- Script: Return Index Info for Table.sql
- To be honest, I found little of interest in the above w/ our current issues
____________________________________________________________
2_Trace It Manually
See below to set the mood.

- Best way to handle this is to run a SQL Activity trace, but it needs both of us online and with time to kill.
- I can also lend Shah to the process if I am not around.
- Some of the below is for his benefit, just in case.
- I can also lend Shah to the process if I am not around.
- I have installed a couple toys to help,
- Sp_BlitzLock
- Handy proc for diagnosing active locks, is now in Master of SQL1 (and SQL0)
- Simple as
- Execute sp_BlitzLock on DB;
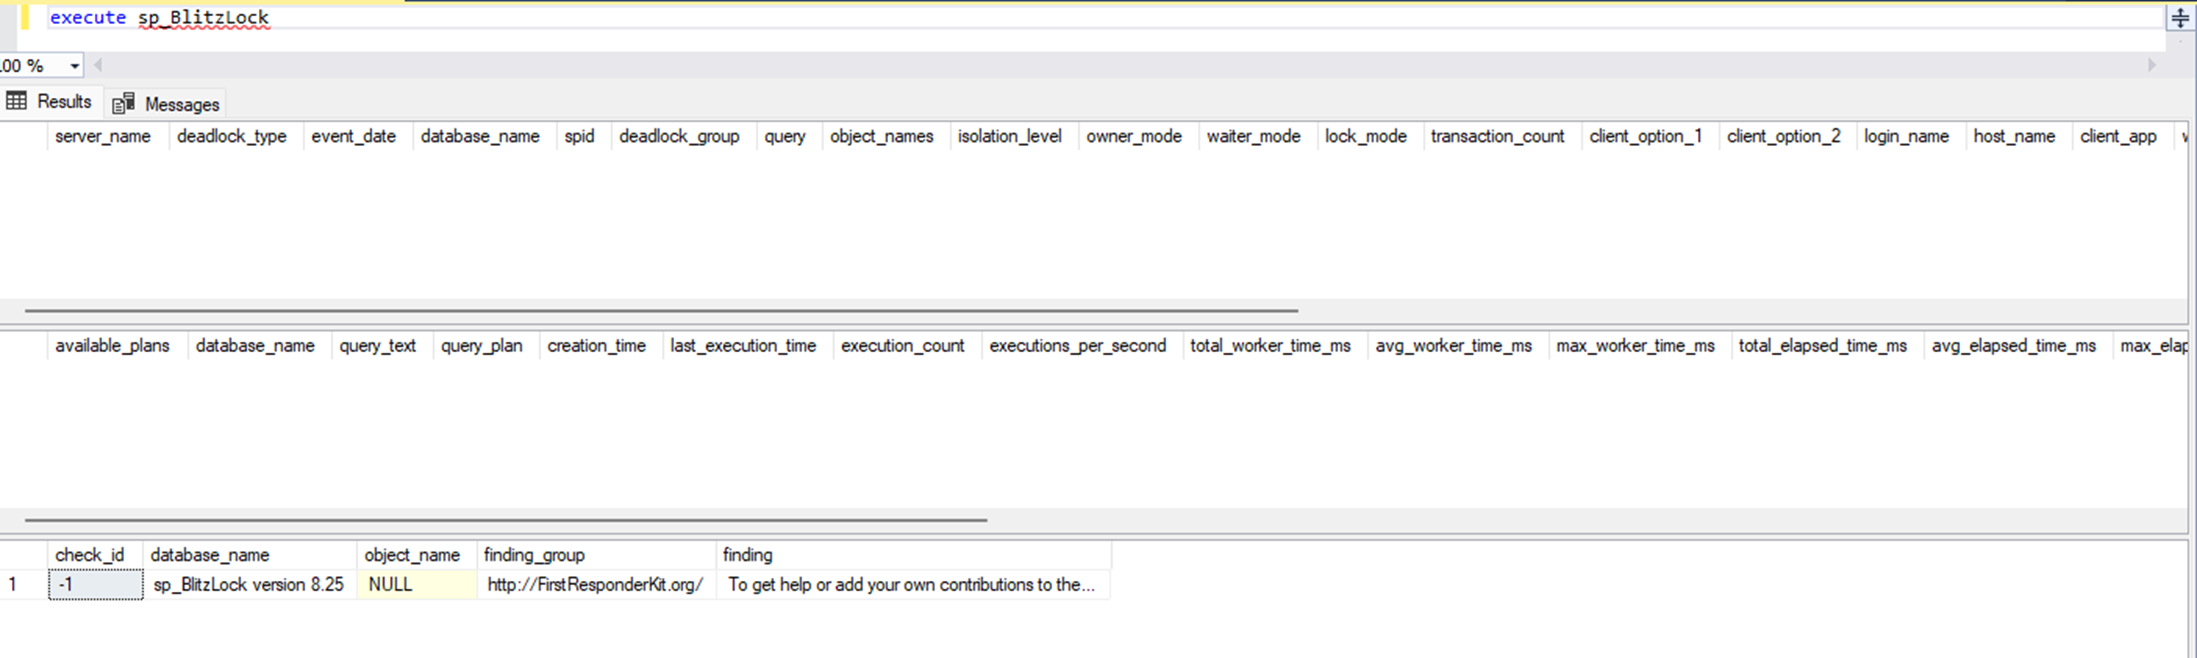
- If there was anything to show:
- Sp_BlitzLock
- SQL Activity Monitor & SSIS Automation Suggestions
- Helpful in the moment, but useless after its already happened.
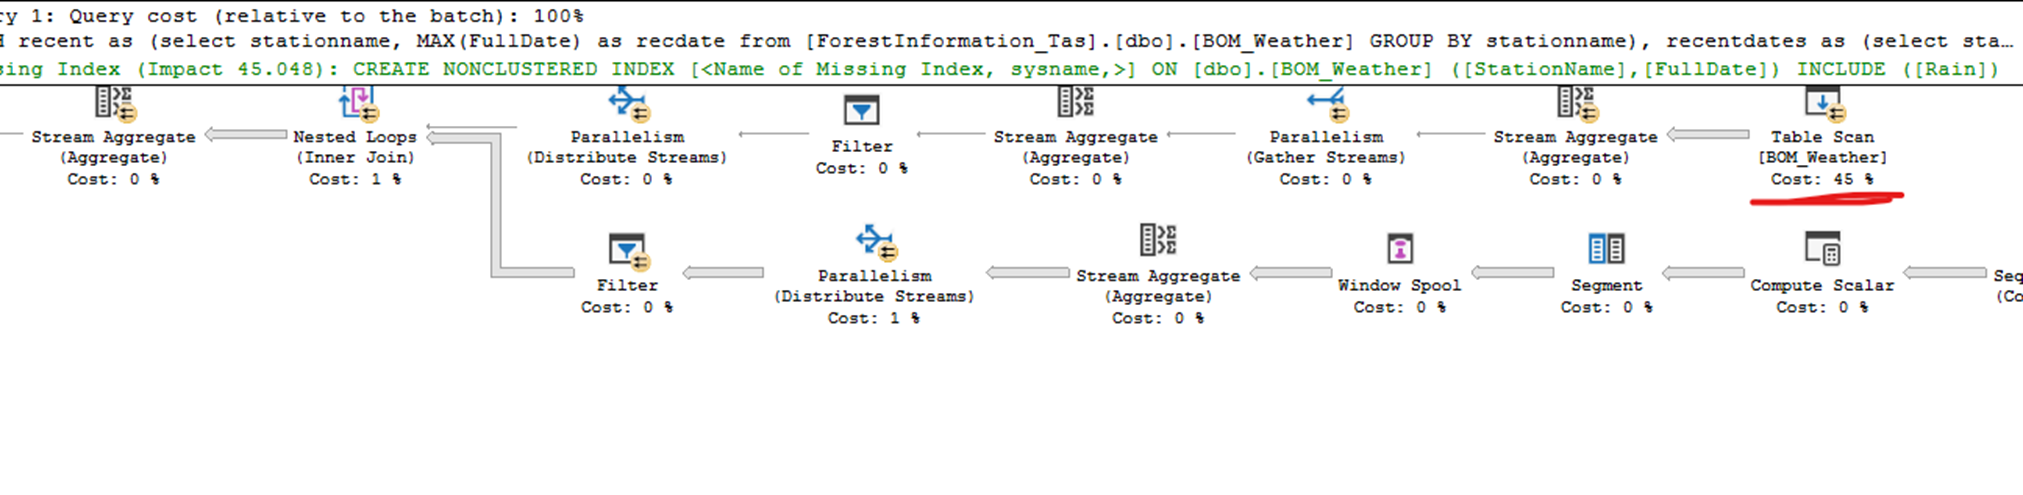
- Using ‘Recent Expensive Queries’ records, you should be able to ID any queries clashing and generating locks and ‘lock_wait’ or ‘deadlock’ status flags.
- By right clicking on expensive queries that affect those locks, you can select “Show Execution Plan”
- This delivers the below screenshot, where it shows you where the wait and lag are of the execution,
- I regularly use this to ID a Stat or Index that is making the process slow and removing / updating it.
See below, it is showing the table scan is taking 45% of the effort (by design with an index, no fix needed)
- Helpful in the moment, but useless after its already happened.
- SQL Profiler
- Full Admin Access Req
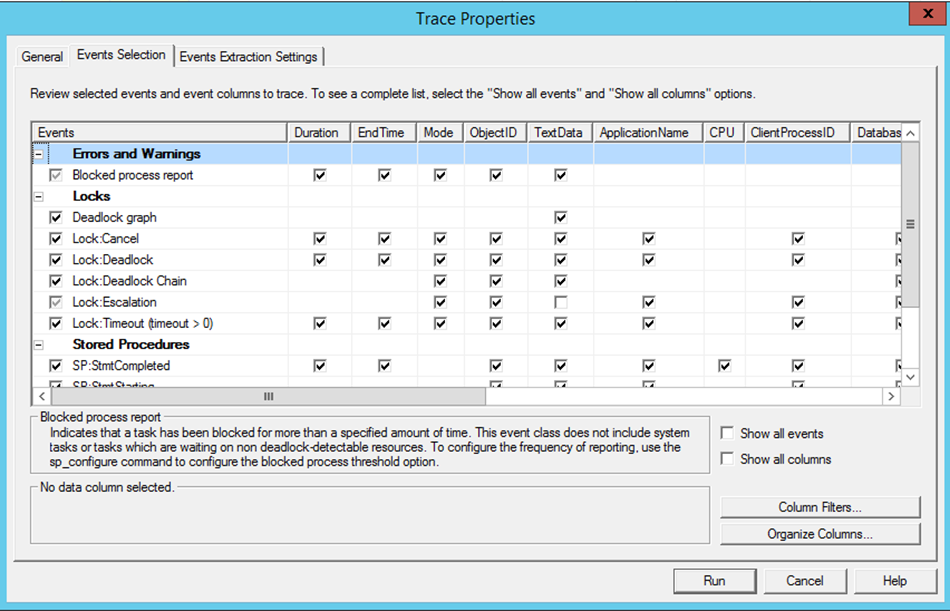
- Will Run a Profiler against active connections as they run,
- Will Slow the DB and Server, down while the trace is running, so we cant leave it running for ages.
- Example of what I would usually focus on
- Example of what I would usually focus on
- Will Slow the DB and Server, down while the trace is running, so we cant leave it running for ages.
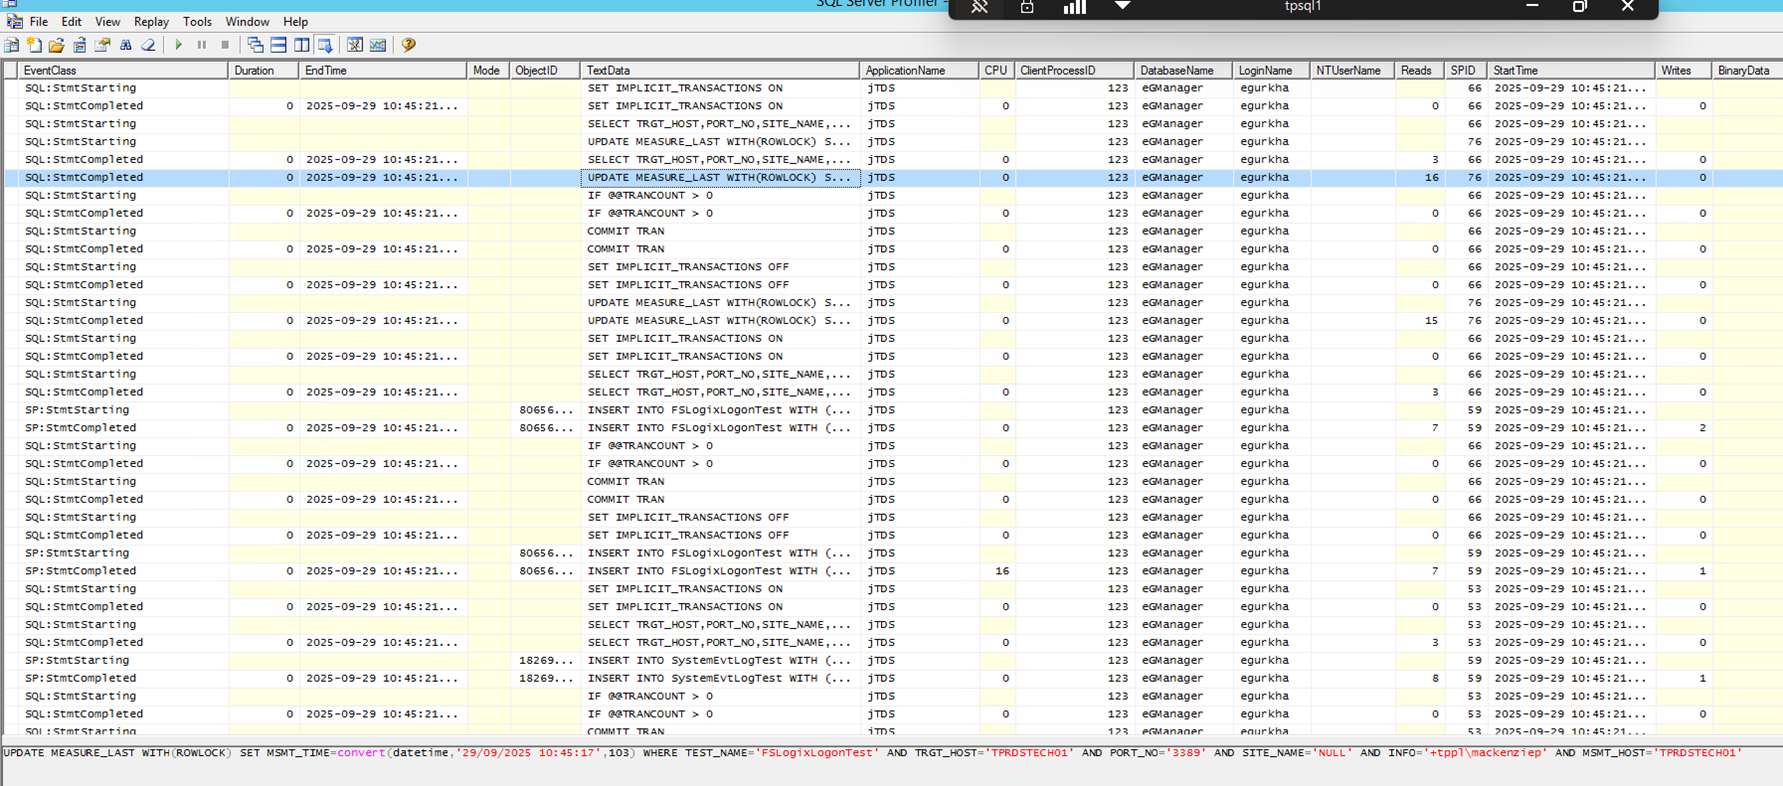
- What the Output looks like: